What if long lasting fluctuations/cycles of solar activity are the main cause of the Global Warming/Climate Change?
Maybe the well known 11-year sunspot cycle (known and tracked since about 1600 CE) is not the only cycle there is!
Fact is that we still know very little about the sun!
"NASA scientists say solar winds and magnetic activity have intensified since 2008, defying expectations and raising the odds of more solar storms that could disrupt satellites, power grids, and communications on Earth."
"The sun has become more and more active over the last 16 years, in a turn that surprised scientists and could affect space weather and technology on Earth, NASA announced ..."
From the abstract:
"Over the course of two decades until 2008, the solar wind became significantly weaker with a constant declining trend in many important solar wind parameters, and solar cycle 24 being the weakest on record since the start of the space age. Here we show that since 2008, the Sun has reversed this long-term weakening trend with a steady increase in various solar wind proton parameters observed at 1 au.
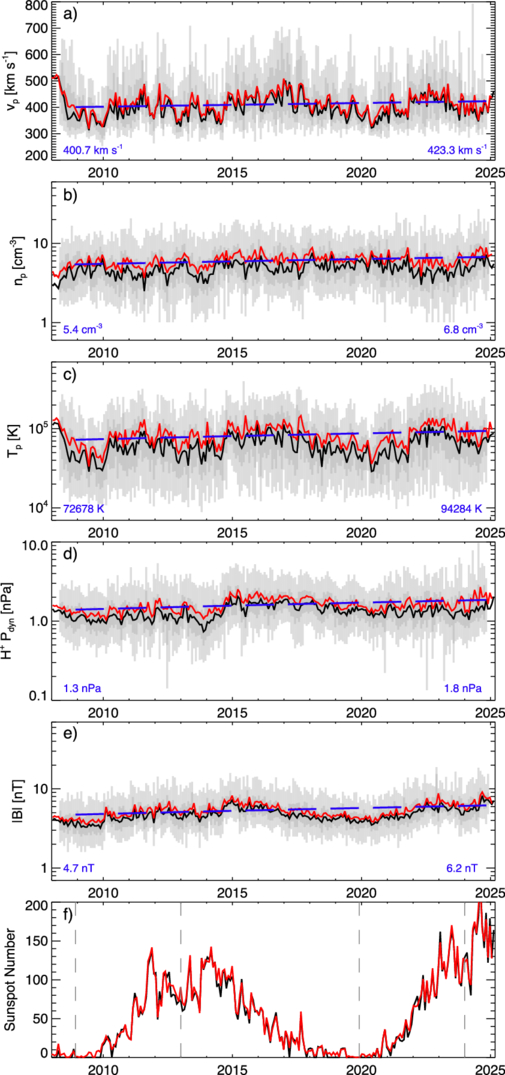
Furthermore, comparison of values from a fitted trend to data between 2008 and 2025 show the following increases in solar wind proton parameters: speed (~6%), density (~26%), temperature (~29%), thermal pressure (~45%), mass flux (~27%), momentum flux or dynamic pressure (~34%), energy flux (~40%), interplanetary magnetic field magnitude (~31%), and the radial component of the magnetic field (~33%).
This has important implications on long-term solar trends, implying that the exceptional weakness of solar cycle 24 was most likely a recent outlier and that the Sun is not entering a modern era Maunder/Dalton-like minimum phase in its solar variation, but is instead recovering from a ~20 yr decline. Presently, the trending average solar wind dynamic pressure of ~1.9 nPa in the current solar cycle, however, is still lower than the recorded ~2.4 nPa at the end of the 20th century.
Continuous future measurements will reveal whether this increase will continue in upcoming solar cycles or whether these parameters will remain stable."
NASA Analysis Shows Sun’s Activity Ramping Up (original news release) "It looked like the Sun was heading toward a historic lull in activity. That trend flipped in 2008, according to new research."
Figure 1. Solar wind measurements of various parameters measured at 1 au since 2008. The measurements are averaged over a complete solar rotation and show mean (red), median (black), 5%–95% ranges (light gray), and 25%–75% ranges (dark gray), and blue shows a fitted trend from the start of 2008 onward (see the text for details). The blue numbers show the values at the start (left) and end (right) of the fitted trend. From top to bottom are
(a) proton speed,
(b) proton density,
(c) proton temperature,
(d) proton dynamic pressure, (e) magnetic field magnitude, and
(f) sunspot number. ...
No comments:
Post a Comment