Showing posts with label solar activity and cycles. Show all posts

Saturday, August 22, 2026

The Wolf Solar Grand Minimum roughly between 1270 and 1350 CE and of other grand solar minimums and grand solar cycles

Here is another reason why the global warming is a hoax and why climate change is a religion! 

Anthropocene greenhouse gases is an obscene explanation! What has probably more influence on climate on Earth when comparing trace gases and varying solar activity? Varying solar activity!

Let's not forget that the world population also increased tremendously over the past several centuries from about 1 billion around 1800 AD/CE to now about 9 billion (aka as the Population Bomb since 1968). Of course, so many humans and their activities largely concentrated in urban areas contribute to warming (e.g. urban heat island effect). However, world population growth might be at an inflection point.

Much more likely are variations in solar activity and solar cycles over short and long term periods that cause warming and cooling periods on Earth than trace gases in the atmosphere! We know for a long time about the 11 year solar activity cycle, but most likely there are other, yet to be discovered cycles like the grand solar cycle.

Grand solar minimums is the missing link I was looking for to possibly explain changes of extended warming to cooling climate periods.

Thanks to the incessant daily climate change demagoguery, the effect of solar activity on Earth climate is heavily suppressed, avoided and omitted! 

"The Wolf Solar Minimum is a grand solar minimum—a prolonged period of sharply reduced sunspot activity and magnetic output on the Sun—that lasted roughly from 1270 to 1350." (Google Search)

This Wolf Solar Minimum roughly coincides with the end of the Medieval Warm Period from about 950 AD/CE to 1250 AD/CE (not medieval climate anomaly) or it falls between the MWP and the Little Ice Age from about 1400 AD/CE to 1850 AD/CE. Or in other words, we are currently in another, modern warm period!

"Major historical grand solar minima identified in solar physics include the following:
Homeric minimum: ~750 BC – 400 BC
Oort minimum: 1040 – 1080
Wolf minimum: 1280 – 1350
Spörer Minimum: 1450 – 1550
Maunder Minimum: 1645 – 1715
Dalton Minimum: 1790 – 1820
Modern Minimum: 2020 – 2053" (Google Search)

From the abstract (1):
"In this editorial I will demonstrate with newly discovered solar activity proxy-magnetic field that the Sun has entered into the modern Grand Solar Minimum (2020–2053) that will lead to a significant reduction of solar magnetic field and activity like during Maunder minimum leading to noticeable reduction of terrestrial temperature. ..."

From the abstract (2):
"Recent progress in undersatanding a role of the solar background magnetic field in defining solar activity is presented using eigen vectors derived with Principle Compnent Analysis.
This approach revealed a presence of not only 11 year solar cycles but also of grand solar cycles with duration of 330-380 years.
We demonstrated that these grand cycles are formed by the interferences of two magnetic waves produced by solar dynamo with dipole magnetic field in two layers of the solar interior with close but not equal frequencies.
These grand cycles are always separated by grand solar minima (GSMs) similar to Maunder minimum type, with the modern GSM started in 2020 and to last until 2053.
This GSM leads to a reduction of solar irradiance by about 0.22% from the modern level and a decrease of the average terrestrial temperature by about 1.0C in the cycle 26.
The reduction of a terrestrial temperature can have important implications for different parts of the planet on growing vegetation, agriculture, food supplies and heating needs in both Northern and Southern hemispheres."

Modern Grand Solar Minimum will lead to terrestrial cooling (1, open access)

Modern grand solar minimum and its impact on the terrestrial environment (2, open access?)


Figure 3. Solar activity (summary) curve restored for 1200–3300 AD


Figure 4.
Top plot: restored total solar irradiance from 1600 until 2014 [Notice the dip around 1812 AD. This when Napoleon tried and failed to conquer Moscow due to an extremely cold winter.]
Bottom plot: Central England temperatures (CET) recorded continuously since 1658. Blue areas are reoccurring cool periods; red areas are warm periods. All times of solar minima were coincident with cool periods in central England.


Thursday, August 20, 2026

Medieval Europe was battered with 16 catastrophic floods in just 2 years (hint: post Medieval Warm Period)

Before the so called "anthropocene" caused current global warming there was the Medieval Warm Period (from about 950-1250 AD/CE) at a considerably lower world population!

Anthropocene is obscene in the context of global warming and climate change (unless you mean that 9 billion humans at body temperature of 36 degrees Celsius and their activities warm up the Earth, but not the atmospheric trace gas CO2)!

Notice that the researchers of the Technische Universitaet Wien also mention low solar activity in the 1330-1340s! What if the sun and it's solar activity and cycles is the major cause for warm periods on Earth?

Very strange, this research does not seem to discuss the relation between these catastrophic floods and the Medieval Warm Period. A very curious omission!

Apparently, we still know little about catastrophic weather or climate events in the past due to lack of records, research activity etc. Thus, the common hysteria and alarmism about current adverse weather events is more like medieval superstition and propaganda!

"In the town of Göttingen, Germany, sits a small parish of stone and red brick. Inscribed on a cross within, a son mourns the loss of his father, Hermann, who drowned in a flood in 1342. Known as the Magdalene flood, the deadly deluge was one of the greatest natural disasters to hit Europe in the past 1000 years.

Despite the devastation, historical records of the flood are scarce. The inscription on the Göttingen cross is the only known text to name a victim. Now, after years of scrubbing archives, researchers are painting a much more complete, and even more devastating, picture of catastrophic weather from this era. In a study published this month in Nature, scientists report evidence of about 16 cascading floods that wreaked havoc across Europe between late 1341 and 1343—the largest number of back-to-back flooding events documented in the past 700 years. ..."

"... Thousands dead, multiannual crop failures
 
More than a thousand entries from contemporary sources were analyzed to study the impact of the floods of this period. ... The historical records present a dramatic picture: “Many thousands of people died in the floods, from hunger and disease,”  ... 

Possible Causes of the Unusual Cluster
 
1342 was the year with the highest number of extreme flood events in the last 700 years, and 1343 is a close third. This cluster was no coincidence: The team found several possible factors that could have contributed to this extraordinary series of floods. Around 1340 and 1341, an unusually high number of volcanic eruptions occurred, including the Hekla eruption in Iceland. Sulfur-containing aerosols in the atmosphere can lead to cooling and alter large-scale circulation patterns.

At the same time, Arctic sea ice had already declined significantly since the mid-1330s, while solar activity in the 1330s-1340s was still relatively low. “The interplay of these factors could have contributed to intense low-pressure systems, prolonged rainfall, and thus the unusual series of floods.” ..." or "combined with reduced incoming solar radiation tends to lead to Northern Hemisphere near-surface air cooling". Which is it? Reduced and varying solar activity itself or reduced incoming solar radiation to blockage in the Earth's atmosphere due e.g. volcanic activity?

From the abstract:
"Europe has experienced extreme floods in recent decades. However, even larger floods are possible and must be considered in flood risk management. Their characteristics can be clarified by analysing the largest documented historical floods.
In Central Europe, the Magdalena Flood of July 1342 is usually considered the largest of the last millennium; however, knowledge of its characteristics is incomplete. 
Here we show that 16 major flood events occurred across much of Europe between late 1341 and 1343. Four of these events had return periods of 500–1,000 years (the Magdalena, Bartholomew, Candlemas and Jacob Floods). Although Magdalena was thought previously to be the only extreme European flood in 1342, our new documentary dataset suggests that it formed part of a broader sequence.
The year with the greatest number of extreme floods during the past 700 years was 1342, and 1343 ranks among the top ten. This highly unusual sequence of floods had substantial socio-economic impacts, including a paradigm shift in flood mitigation measures in Europe.
A series of volcanic eruptions along with multi-annual Arctic sea ice retreat is a plausible cause of this flood sequence.
Clusters of extreme floods occurring within a few months are rarely considered in risk management. Quick and proactive risk strategies are needed that account for this eventuality."

Medieval Europe was battered with 16 catastrophic floods in just 2 years | Science | AAAS

The Flood of the Millennium That Wasn't a Single Flood (original news release) "Surprising Findings from Historical Data: the famous flood of 1342 was not an isolated event, but a series of events – providing insights for climate research and risk assessment."


Old picture of a flooding (Luzern, from e-codices)


A Late Medieval Latin chronicle entry about the series of floods of 1342–43


Fig. 2: Spatiotemporal distribution of floods and weather information in 1342 and 1343.


Fig. 3: Socio-economic impacts of floods in 1342 and 1343.


Fig. 4: Annual frequency of great and extraordinary floods in Europe in the last 700 years. [Notice the peculiar jump around 1850 that is at the end of the Little Ice Age.]


Wednesday, August 05, 2026

Sun Revealed In Stunning Clarity With Record-Breaking New Images

Update of 8/6/2026: "Telescope captures sun's surface in sharpest detail ever Researchers using the Daniel K. Inouye Solar Telescope in Hawaii have captured the highest-resolution images yet of the sun's outer shell. The images reveal feathery and rippling patterns caused by magnetized plasma ..." IEEE USA Smartbrief

Amazing stuff! We still know so little about the sun! What if the solar activity and cycles of the sun is the main cause of global warming/climate change?

(721) Sun Revealed In Stunning Clarity With Record-Breaking New Images | WION originals - YouTube


Gallery Images from the Inouye


Monday, July 13, 2026

Neue Studie: Die Sonne als Klimaregisseur – 2.000 Jahre Klimageschichte zeigen solare Spuren im Mittelmeerraum

Empfehlenswert! Ich habe hier seit einigen Jahren zu dem Thema das schwankende Sonnenaktivität ursächlich sind für Klimaschwankungen auf der Erde statt CO2.

"Die Sonne ist der Motor des irdischen Klimas. Ohne ihre Energie gäbe es keine Ozeane, keine Atmosphäre und kein Leben. Trotzdem spielt die Sonne in vielen aktuellen Klimadiskussionen nur eine Nebenrolle. Häufig wird argumentiert, dass die Schwankungen der Sonnenleistung zu gering seien, um relevante Klimaänderungen auszulösen.

Eine neue im Juli 2026 im Fachblatt Heritage veröffentlichte wissenschaftliche Arbeit aus Italien zeigt nun, dass diese Betrachtungsweise möglicherweise zu kurz greift. Die Autoren untersuchten die Klimageschichte des Mittelmeerraums über einen Zeitraum von rund 2.000 Jahren und fanden Hinweise darauf, dass Veränderungen der Sonnenaktivität mit langfristigen Schwankungen der Niederschlagsverteilung verbunden waren. Dabei geht es nicht um eine simple Aussage wie „mehr Sonne bedeutet wärmeres Klima“. Das Klimasystem ist wesentlich komplexer. Die Sonne kann über verschiedene Prozesse die atmosphärische Zirkulation beeinflussen – und damit verändern, wo, wann und wie viel Niederschlag fällt. ..."

From the abstract:
"This study presents a meta-analysis of relatively high-resolution paleohydrological proxies derived from geological archives in Sardinia and in the Italian Peninsula–Sicily over the last 2000 years, with particular emphasis on the Medieval Warm Period (MWP) and the Little Ice Age (LIA).
The investigated climate proxies, ranging from annual-decadal to centennial resolution, include terrestrial and marine sediment cores, glaciers, pollen spectra, speleothems, lake-level fluctuations, as well as sedimentary and geomorphological inventories.
Such datasets were analyzed through holistic and stratigraphic approaches along West–East and North–South transects across the central Mediterranean. Limited temporal resolution and incomplete stratigraphic continuity of several paleoclimatic records from the investigated regions thwart full reconstructions of paleohydrological trends.
Nevertheless, the presented meta-analysis has enabled:
(1) the recognition of reliable paleoclimatic correlations between the two regions, which exhibit long-lasting anti-phase hydroclimatic trends (wetter conditions in Sardinia and drier conditions in central Italy during the MWP, with the opposite pattern during the LIA); and
(2) the identification of the North Atlantic Oscillation (NAO) as the primary driver of these paleohydrological variations.
The significance of this anti-phase pattern is discussed in the context of the North–South and West–East climatic dipoles identified in the Mediterranean region during the middle to late Holocene.
Furthermore, we assessed the potential of the investigated paleohydrological network to:
(1) compare reconstructed hydrological patterns with mean temperature and precipitation records derived from empirical and model-based climate reconstructions in southern Europe and the Mediterranean; and
(2) identify gaps in data coverage that currently limit our understanding of high-resolution spatiotemporal hydrological variability and dynamics
The hydroclimatic pattern in Sardinia and in the Italian Peninsula–Sicily has exhibited marked spatio-temporal divergences, with major hydroclimatic transitions coincident with well-known solar minima over the last millennium, thus suggesting a possible cause-and-effect relationship. The interpretations presented in this study provide a framework for understanding how changes in the paleoclimatic variability of water resources may have influenced different regions of Italy since the Middle Ages, potentially affecting societal transitions as well as historical and socioeconomic dynamics.
Comparison of the multidecadal-to-centennial reconstructions of paleohydrological patterns is presented for both areas, pending the development of new, higher-resolution, and more precisely dated proxies from the Italian records. Their importance is emphasized in order to improve reconstructions of past climate variability and to enhance assessments of future climate trajectories."

Neue Studie: Die Sonne als Klimaregisseur – 2.000 Jahre Klimageschichte zeigen solare Spuren im Mittelmeerraum – KlimaNachrichten

Monday, September 22, 2025

NASA scientists say solar winds and magnetic activity have intensified since 2008 (so has Global Warming?)

What if long lasting fluctuations/cycles of solar activity are the main cause of the Global Warming/Climate Change?

Maybe the well known 11-year sunspot cycle (known and tracked since about  1600 CE) is not the only cycle there is!

Fact is that we still know very little about the sun!

"NASA scientists say solar winds and magnetic activity have intensified since 2008, defying expectations and raising the odds of more solar storms that could disrupt satellites, power grids, and communications on Earth."

"The sun has become more and more active over the last 16 years, in a turn that surprised scientists and could affect space weather and technology on Earth, NASA announced ..."

From the abstract:
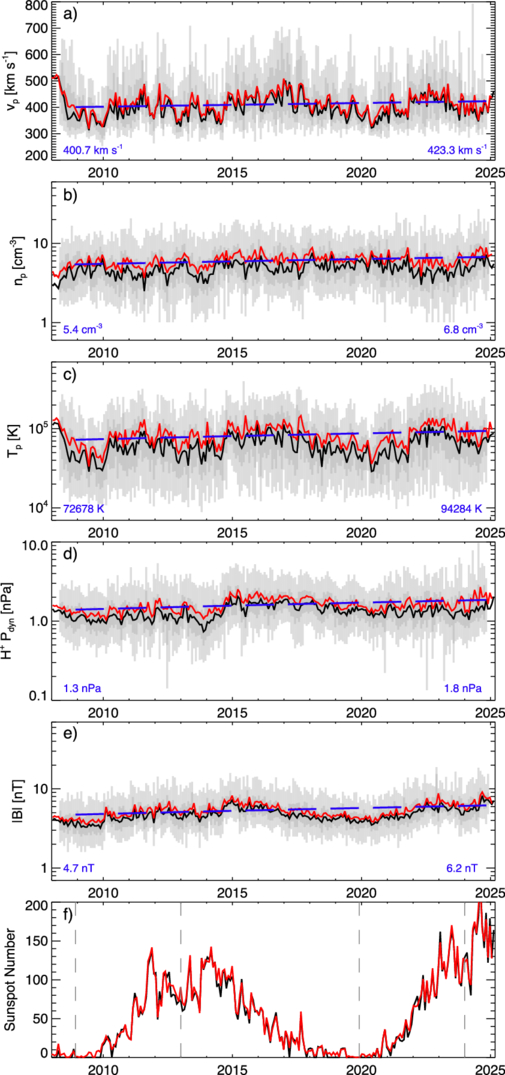
"Over the course of two decades until 2008, the solar wind became significantly weaker with a constant declining trend in many important solar wind parameters, and solar cycle 24 being the weakest on record since the start of the space age. Here we show that since 2008, the Sun has reversed this long-term weakening trend with a steady increase in various solar wind proton parameters observed at 1 au.
Furthermore, comparison of values from a fitted trend to data between 2008 and 2025 show the following increases in solar wind proton parameters: speed (~6%), density (~26%), temperature (~29%), thermal pressure (~45%), mass flux (~27%), momentum flux or dynamic pressure (~34%), energy flux (~40%), interplanetary magnetic field magnitude (~31%), and the radial component of the magnetic field (~33%).
This has important implications on long-term solar trends, implying that the exceptional weakness of solar cycle 24 was most likely a recent outlier and that the Sun is not entering a modern era Maunder/Dalton-like minimum phase in its solar variation, but is instead recovering from a ~20 yr decline. Presently, the trending average solar wind dynamic pressure of ~1.9 nPa in the current solar cycle, however, is still lower than the recorded ~2.4 nPa at the end of the 20th century.
Continuous future measurements will reveal whether this increase will continue in upcoming solar cycles or whether these parameters will remain stable."

Thursday, September 18, 2025 - Join The Flyover


NASA Analysis Shows Sun’s Activity Ramping Up (original news release) "It looked like the Sun was heading toward a historic lull in activity. That trend flipped in 2008, according to new research."


Figure 1. Solar wind measurements of various parameters measured at 1 au since 2008. The measurements are averaged over a complete solar rotation and show mean (red), median (black), 5%–95% ranges (light gray), and 25%–75% ranges (dark gray), and blue shows a fitted trend from the start of 2008 onward (see the text for details). The blue numbers show the values at the start (left) and end (right) of the fitted trend. From top to bottom are 
(a) proton speed, 
(b) proton density, 
(c) proton temperature,
(d) proton dynamic pressure, (e) magnetic field magnitude, and 
(f) sunspot number. ...


Saturday, September 13, 2025

The Race to the Sun's Surface

Very recommendable! Almost a suspense movie!

We still know shockingly little about the sun and its varying if not periodic solar activity. What if the sun is one of the dominant factors determining climate change on earth?  There is a strong, but possibly wrong, presumption (inductive bias) that the output of the sun is like a constant!


Thursday, August 21, 2025

Solar probe confirms decades-old theory about the Sun’s magnetic reconnection

Amazing stuff!

We still know shockingly little about the sun and its varying if not periodic solar activity. What if the sun is one of the dominant factors determining climate change on earth?

"... Data captured by NASA’s Parker Solar Probe has confirmed that the Sun’s magnetic field lines break to reconnect in a new configuration, releasing large amounts of energy. ..."

"New research ... has confirmed decades-old theoretical models about magnetic reconnection, the process that releases stored magnetic energy to drive solar flares, coronal mass ejections and other space weather phenomena. The data was captured by NASA’s Parker Solar Probe (PSP), which is the only spacecraft to have flown through the Sun’s upper atmosphere. 

Magnetic reconnection occurs when magnetic field lines in plasma sever and reconnect in a new configuration, releasing large amounts of stored energy. On the Sun, this energy release often results in solar activity that can affect technology on Earth, a phenomenon known as space weather. 
Modeling solar magnetic reconnection accurately may help predict coronal mass ejections, solar flares and other space weather events that can impact satellites, communication systems and even power grids on Earth. ..."

From the abstract:
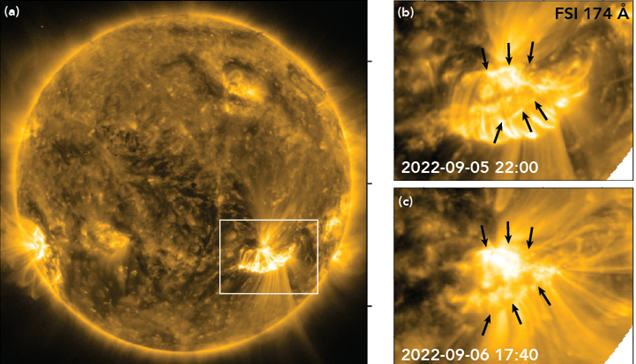
"Magnetic reconnection is a fundamental process within highly conductive plasmas. Oppositely oriented field lines are reconfigured, releasing stored magnetic energy. It plays a vital role in shaping the dynamics of the solar corona and provides one of the main mechanisms for releasing the stored energy that powers solar eruptions. Reconnection at the Sun has been studied using remote-sensing observations, but the Parker Solar Probe (PSP) now permits in situ sampling of reconnection-related plasma in the corona.
Here we report on a PSP fly-through of a reconnecting current sheet in the corona during a major solar eruption on 5–6 September 2022. We find that even 24 h after the flare peak, PSP detected the reconnection exhaust, indicating continuing fast reconnection, which we confirmed using remote-sensing observations made by the Solar Orbiter.
This reconnection persisted much longer than typical timescales of a few minutes to hours. Plasma parameters measured by PSP within the reconnection region match numerical simulations.
These new observations provide a key bridge between theory and measurements of plasmas in the solar atmosphere, laboratory experiments and astrophysical systems, generating new constraints required for the refinement of models and for the strengthening of their links to observations at many scales."

Solar probe confirms decades-old theory about the Sun’s magnetic reconnection

SwRI-led work confirms decades-old theoretical models about solar reconnection "Research helps fill crucial observation gaps about process that drives solar flares, coronal mass ejections"


Coronal Mass Ejection Source


Sunday, July 20, 2025

Wie die zyklische Sonnenaktivität den jährlichen Dürretrend in Europa beeinflusst

Wie die Sonnenaktivität den Klimawandel beeinflusst und nicht CO2!

Wir wissen immer noch unglaublich wenig über unsere Sonne! Ist nicht die Sonne der größte Einfluss auf Klimaveränderungen auf der Erde?

Bisher kennen wir anscheinend nur sehr kurze, solcher Zyklen (maximal wenige Jahrzehnte). Vielleicht gibt es auch, bisher unentdeckte, jahrhunderte lange Zyklen usw.

"... Der Dürretrend der letzten Jahre beruht in weiten Teilen von Europa primär auf dem 22-jährigen Hale-Zyklus der Sonne.
Die solar verursachte Schwankungsbreite der Dürreintensität und Jahresniederschlagssumme ist viel größer als Änderungen, die dem anthropogen verursachten Klimawandel angelastet werden.                                                                                            
Das Ausmaß des solaren Einflusses sprengt alle Vorstellungen, die Wissenschaftler bisher über den möglichen Einfluss der Sonnenaktivität auf Wettertrends hatten.
In der Klimawissenschaft gängige Frequenzanalysen sind blind gegenüber dem in diesem Beitrag gezeigten Hale-Muster in Niederschlagssumme und Dürreindex.
Der solare Einfluss ermöglicht mehrjährige Langfristprognosen mit Vorhersage extremer Jahre mit Dürre wie 2018 oder hoher Niederschlagssumme wie 2023.
Der Nachweis solaren Einflusses wirft viele neue Fragen auf und stellt bisherige Behauptungen über die Ursache aktueller Klimaveränderungen infrage."

Wie die Sonnenaktivität den jährlichen Dürretrend in Europa beeinflusst – KlimaNachrichten

Thursday, July 10, 2025

The Closest Images Ever Taken of the Sun’s Atmosphere

Recommendable! We still know very little about our sun! What if the solar activity fluctuates and determines climate on earth? You can trash the so called greenhouse gas superstitions immediately!

Tuesday, June 24, 2025

Listen to the sounds of the Sun like never before

Amazing stuff! What if the fluctuations of solar activity are the main cause of climate change on earth? I bet it is the case! We still know very little about the sun!

Wednesday, June 11, 2025

Our first ever look at Sun's south poles 〰️🌞

Recommendable! We still know so little about the sun! It is shocking! What if the sun is mostly responsible for climate change on earth?

Sunday, June 08, 2025

The world's worst solar storm struck about 14,000 years ago, much stronger than the 775 AD event

Amazing stuff! Unfortunately the article does not say e.g. how these solar storms affect life on earth.

What if changes in solar activity cause warming and cooling periods (aka climate change) on earth and not a life-essential, atmospheric trace gas like CO2?

These so called Miyake events were not even discovered before 2012. This suggests there might be more of these events to be discovered.

"A study ... has uncovered evidence of an extreme ancient solar storm that struck Earth over 14,000 years ago, during the waning days of the last Ice Age. This event is now confirmed as the most powerful solar particle storm on record, exceeding the infamous 775 CE storm that was long considered the strongest. ...

These unusual spikes of isotopes that can be captured in tree rings are known as Miyake events. ...

Although several Miyake events have been traced back to 994 CE, 663 BCE, 5259 BCE, and 7176 BCE, none surpassed the severity of the 775 CE spike. In 2023, researchers discovered a 40% spike in radiocarbon in a fossilized tree ring corresponding to 14,000 BCE, but the existing models could not quantify the event’s intensity under ancient glacial climatic conditions. ..."

"... “Compared to the largest event of the modern satellite era — the 2005 particle storm — the ancient 12350 BC event was over 500 times more intense, according to our estimates”, says Dr. Golubenko.

Other large known solar particle storms have occurred around 994 AD, 663 BC, 5259 BC and 7176 BC, and a few other candidates are under investigation. The new model was also verified using wood samples recently found in the French Alps, dating back some 14,300 years. ..."

From the highlights and abstract:
"Highlights
• A new generation model of atmospheric radiocarbon transport is developed, which applies to spikes of C for different climatic and geomagnetic conditions.
• The only known extreme solar proton event beyond the Holocene (ca. 12350 BC) is analysed with this model and shown to be the strongest solar event known so far.
• The model was successfully tested in application to a well-studied event of 775 AD.

Abstract
The Sun rarely produced extreme solar particle events (ESPEs), orders of magnitude stronger than everything directly observed. Their enormous power can greatly distort the production of cosmogenic isotopes, e.g., radiocarbon 14C, in the terrestrial system, leaving clear signatures in natural terrestrial archives including dateable tree rings.
Eight such events were known to occur during the past 12 millennia of the Holocene, with the strongest one being that of 775 AD.
Recently, a new and the only ESPE candidate beyond the Holocene has been discovered as the largest known 14C peak dated to ca. 12350 BC, nearly twice as big as that of 775 AD. However, it could not be analysed earlier due to the lack of appropriate models applicable to glacial climate conditions.
We have developed a brand-new state-of-the-art chemistry-climate model SOCOL:14C-Ex to study fast changes in 14C. It was tested on the well-studied event of 775 AD and applied to the ESPE of 12350 BC. We found that it was stronger by 18±11% than by 775 AD and likely occurred between January – April 12350 BC with the most probable date in early March. This makes the ESPE of 12350 BC the record strongest known event, pushing the bounds of the extreme solar-terrestrial events even further, forming the new worst-case scenario paradigm and providing the global tie point for dendrochronological dating before the Holocene. The newly developed model lifts the existing limitation to the Holocene and extends our ability to analyse radiocarbon data even for glacial climate conditions."

Ancient solar storm 18 percent stronger than 775 AD event

The most extreme solar storm hit Earth in 12,350 BC, scientists identify (press release) "New research uncovers the strongest solar event ever detected — rewriting our understanding of space weather and radiocarbon dating."


Graphical abstract


Tuesday, April 08, 2025

The April 2024 solar eclipse’s darkness caused dawn-singing birds starting to produce their dawn chorus

Amazing stuff! Birds get confused too! 😊🐦

"But the eclipse wasn’t just limited to atmospheric findings. Using more than 10,000 observations from citizen scientists and over 100,000 vocalizations, a team of biologists aimed to find out how birds respond when it suddenly gets dark during the day. They found that, while dusk-singing birds did not change their behavior before or during the eclipse, those that sing in the morning were affected. Their early findings, published as a preprint on bioRxiv, revealed that more than half of wild bird species started singing their dawn chorus after the eclipse, as if it were sunrise. The study highlights the sensitivity of animal behavior to light—in a world where artificial light is on the increase."

From the abstract:
"On April 8th 2024, a total solar eclipse disrupted light-dark cycles for North American birds during the lead-up to spring reproduction. Compiling over 10,000 community observations and AI analyses of nearly 100,000 vocalizations, we found that bird behavior was significantly affected by these few minutes of unexpected afternoon darkness. More than half of wild bird species changed their biological rhythms, with many producing a dawn chorus in the aftermath of the eclipse. This natural experiment demonstrates the power of technology-enabled and public science projects to understand our natural world. Further, it underscores the power of light in structuring animal behavior: even when 'night' lasts for just four minutes, robust behavioral changes ensue."

ScienceAdviser


Wednesday, January 29, 2025

Sun's Violent Behaviour Alarms Space Scientists

Very recommendable! We still know so little about the sun and solar activity! What if the sun is mostly responsible for global warming?

Wednesday, December 25, 2024

Astronomers trying to discover if the Sun could produce catastrophic superflares

Amazing stuff! We still know so little about our sun and its solar activity and cycles!

What if fluctuating solar activity explains most of global warming and climate change?

"But interesting, and somewhat scary, new research, has now revealed that superflares occur roughly once per 100 years in other stars like our Sun elsewhere in the universe. ..."

From the editor's summary and abstract:
"Editor’s summary
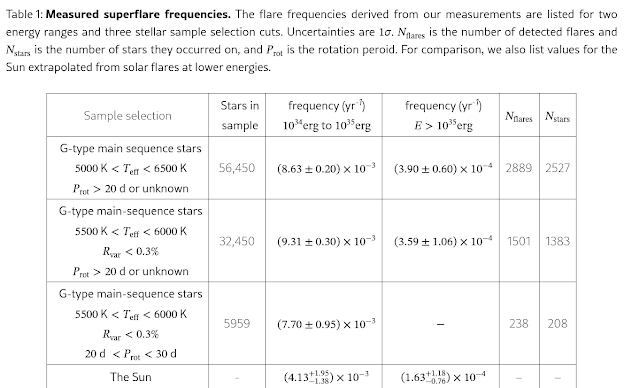
Solar flares are bright, transient, multiwavelength emissions from active regions on the Sun. The most intense directly observed solar flares release energies of about 1032 erg. It is unclear whether the Sun can produce more intense flares than that or how often they might occur. Vasilyev et al. investigated brightness measurements of 56,000 Sun-like stars observed by the Kepler space telescope. They identified almost 3000 bright stellar flares with energies of about 1034 to 1035 erg, which are called superflares. The occurrence rate is about one superflare per star per century. If the Sun behaves like the stars in this sample, then it could produce superflares at a similar rate. ...
Abstract
Stellar superflares are energetic outbursts of electromagnetic radiation that are similar to solar flares but release more energy, up to 1036 erg on main-sequence stars. It is unknown whether the Sun can generate superflares and, if so, how often they might occur. We used photometry from the Kepler space observatory to investigate superflares on other stars with Sun-like fundamental parameters. We identified 2889 superflares on 2527 Sun-like stars, out of 56,450 observed. This detection rate indicates that superflares with energies >1034 erg occur roughly once per century on stars with Sun-like temperature and variability. The resulting stellar superflare frequency-energy distribution is consistent with an extrapolation of the Sun’s flare distribution to higher energies, so we suggest that both are generated by the same physical mechanism."

Astronomers trying to discover if the Sun could produce catastrophic superflares