- Economists have warned of Canada’s weak business investment, particularly compared to the United States. This should concern Canadians as strong business investment is key to higher incomes, greater economic prosperity, and improved living standards.
- Real ($2017) non-residential business investment per worker in the United States exceeded that of Canada in every year from 2007 to 2024:
Canada’s business investment declined by $852 per worker from $17,345 to $16,493 while US investment grew by $11,203 per worker from $19,352 to $30,555. - The gap between Canada and the United States increased significantly after 2014 as real business investment began to decline in Canada.
In 2014, Canada invested about 87 cents per worker for every dollar invested in the United States; in 2024, investment was 54 cents for every US dollar. - In 2014, three Canadian provinces had significantly higher real business investment per worker than the United States ($23,263):
Alberta ($56,401),
Newfoundland & Labrador ($53,779), and
Saskatchewan ($48,715)
By 2024, real US business investment per worker ($30,555) exceeded that of any Canadian province except Saskatchewan ($33,386).
..."
In honor of Thomas Paine and other Founders & Immigrants. In memory of my daddy Horst Bingel and my mom Irma Bingel
Sunday, September 06, 2026
Comparing Business Investment per Worker In Canada and the United States, 2007–2024
Tuesday, September 01, 2026
Chart of the day
Is Canada falling behind the US in terms of living standards? Gap in living standards between Canada and the U.S. has more than doubled from 1999-2024; U.S. now $23,757 higher than Canada
And Canada wants to engage in a trade war with President Trump?
Thursday, August 13, 2026
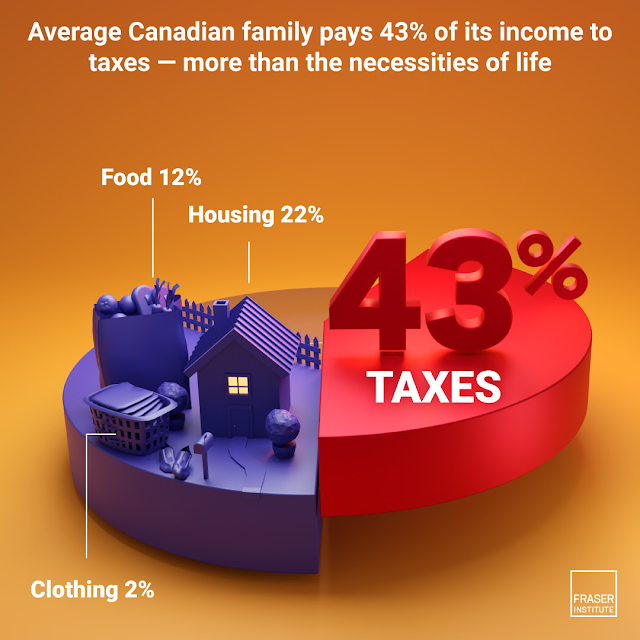
The average Canadian family spent 42% of its income on taxes in 2025 - which is more than they spent on housing, food, and clothing combined.
- The Canadian Consumer Tax Index tracks the total tax bill of the average Canadian family from 1961 to 2025. Including all types of taxes, that bill has increased by 2,928% since 1961.
- Taxes have grown much more rapidly than any other single expenditure for the average Canadian family: expenditures on shelter increased by 2,349%, food by 952%, and clothing by 526% from 1961 to 2025.
- The 2,928% increase in the tax bill has also greatly outpaced the increase in the Consumer Price Index (946%), which measures the average price that consumers pay for food, shelter, clothing, transportation, health and personal care, education, and other items.
- The average Canadian family now spends more of its income on taxes (41.9%) than it does on basic necessities such as food, shelter, and clothing combined (36.0%). By comparison, 33.5% of the average family’s income went to pay taxes in 1961 while 56.5% went to basic necessities.
- In 2025, the average Canadian family earned an income of $121,111 and paid total taxes equaling $50,721 (41.9%). In 1961, the average family had an income of $5,000 and paid a total tax bill of $1,675 (33.5%).
Saturday, August 08, 2026
Business investment in Canada barely enough to offset depreciation since 2018
- Canada’s stagnant productivity performance over the past decade is tied to weak investment in non-residential assets such as factories, plants, machinery, equipment, and intellectual property.
- While there is some understanding of the country’s weak national performance in attracting investment, the performance of individual provinces is less well known and is important for an understanding of the current tensions within the country.
- Between 2018 and 2025, three provinces experienced an average annual decline in the overall value of their non-residential assets, meaning that the current levels of investment were insufficient to offset the depreciation (i.e., wear and tear) of existing assets.
- Alberta (-1.05%), Newfoundland & Labrador (-0.67 percent), and Saskatchewan (-0.44 percent) all recorded average annual real (i.e., inflation-adjusted) declines in the value of the stock of non-residential assets like plants, machinery, equipment, and intellectual property. Put simply, the stock of these assets was worth less in 2025 than it was in 2018 (inflation-adjusted).
- Over the same period, the nation as a whole recorded markedly weak growth in the stock of non-residential assets (0.99 percent), on an average annual basis.
Sunday, August 02, 2026
Health-care costs for typical Canadian family will reach over $21,000 this year. Really!
- Canadians often misunderstand the true cost of our public health care system. This occurs partly because Canadians do not incur direct expenses for their use of health care, and partly because Canadians cannot readily determine the value of their contribution to public health care insurance.
- In 2026, preliminary estimates suggest the average payment for public health care insurance ranges from $6,464 to $21,115 for six common Canadian family types, depending on the type of family.
Saturday, July 25, 2026
Increasing geographical trade with non-U.S. markets in China and India could significantly decrease Canada’s reliance on the U.S. Really!
Sunday, February 01, 2026
Friday, December 19, 2025
Chart of the day
Bad news! Serious stuff! What it is going on in Canada! However, World Bank data contradicts the chart below. I don't have the time to investigate this discrepancy.
However, the World Bank shows following chart for 1975-2024 (Source)
What gives?
Thursday, December 11, 2025
Tuesday, December 09, 2025
Chart of the day
How much is Canada' healthcare deteriorating?
What is wrong with the chart?
- Only one historical year was selected for comparison (cherry picking?)
- Lack of a short explanation why 1993
Thursday, October 02, 2025
Chart of the day
The considerable perks/privileges of employment in government versus in the private sector in Canada. I bet, the situation in many Western countries is not much different.
Tuesday, July 08, 2025
Chart of the day
The distinction between non-permanent and permanent immigration is important. This change in the ratio shown for Canada over the past 25 years is dramatic.
Unfortunately, a lot of talking heads and ideologues like to confuse migrants and immigrants in daily discourse.
I believe some smaller European countries (e.g. Luxembourg, Switzerland) have a similar ratio like Canada, but going back several decades further than Canada.
Thursday, June 05, 2025
Saturday, December 14, 2024
Waiting Your Turn: Wait Times for Health Care in Canada, 2024 Report
Tuesday, December 10, 2024
Chart of the day
Bad news! However, the chart does not show the money amount of donations, very poorly done Fraser Institute!
Thursday, November 28, 2024
Rising violent crime in Canada since Prime Minister Justin Trudeau took office in 2015
Under Prime Minister Justin Trudeau crime is up in Canada and higher than in the US! He is in office since 2015 when the rise in violent crime began! Source
Once upon a time Canada was advertised as a paragon of much less crime ridden!
Tuesday, October 22, 2024
Chart of the day
I bet Canada is not the only Western country with such a lopsided development of employment between the government and private sector!
A few days ago, I blogged here about how the U.S. government manipulates the employment statistics and how government hiring was the major driver of employment gains.
Tuesday, August 20, 2024
Chart of the day
As they say money talks! I bet, in other Western countries, the situation is similar!
That is a sure recipe for single individual households without children! (Source)
Wednesday, August 14, 2024
Chart of the day
This is a serious and unsustainable imbalance in Canada! It may threaten federalism. It may lead to secession.